
Teams | Collaboration | Customer Service | Project Management

The Pitman Schedule

The Pitman schedule covers a 24/7 operation with four teams on 12-hour shifts, running a two on, two off, three on pattern across a 14-day cycle. Every team gets every other weekend off and never works more than three days in a row. It is popular for good reasons. It is also the schedule most likely to produce an overtime bill nobody budgeted, because 84 hours per fortnight means alternating 36-hour and 48-hour weeks, and the second one is over the federal threshold.

Field Service Communication: Keeping Growing Teams in Sync From Office to Job Site

A technician kneeling under a customer's sink has three questions in mind: what happened on the last visit, is the right part on the truck, and who to call if the job turns out bigger than quoted. On a crew of five, the answers live in someone's head. On a crew grown to fifteen or twenty, they're scattered across personal phones, half-remembered calls, and a shared inbox nobody fully trusts. That's the point where field service communication stops being a habit and needs an actual system.

How to Track Essential Milestones in Data-Heavy Research Projects

Data-heavy research projects can involve large datasets, multiple researchers, several review stages, and changing requirements. Effective management uses clear progress tracking to stay aligned. Without a clear way to track progress, teams can lose sight of what has been completed. Moreover, they may miss upcoming tasks and deadlines. For data-heavy research projects, researchers ask how to track work with milestones.

How to reduce cost overruns on projects already in flight

Most advice on cost overruns is really advice about the next project. Estimate better, add contingency, tighten the SOW. All true, and none of it helps the project that's 40% delivered and 55% spent right now. This guide is about that project. You'll get a weekly check I call the Burn Gap Triage, three moves for closing the gap, and the delivery habits that stop small leaks becoming write-offs.

Project profitability analysis: find out why margin moved

A project's margin is an output: it's whatever is left once pricing, staffing, hours, scope and billing have all had their say. Project profitability analysis is the work of tracing that number back to the decisions that produced it. In this guide, I'll walk you through the Five-Lever Margin Bridge and a six-step review that prices each cause in dollars. Then we'll test both on a worked example that reconciles exactly.

Easy Employee Monitoring for Growing Businesses: Fast Setup & Low-Overhead Analytics

The fast-growing company does not have a large IT team, resources dedicated to security, or weeks to deploy an enterprise workforce analytics solution. Despite all this, organizations demand intelligence on how their workforce leverages the tools that they employ, where the bottlenecks lie, and how effective they are at safeguarding the organization’s data. That creates a difficult balancing act.

Service business profitability: the five levers that actually move margin

In a services firm, your people are both the product and the cost, so service business profitability gets decided in five places at once. It's what you charge, what you collect, how much capacity you sell, who does the work and what the firm costs to run. This guide runs all five through one worked model. Then a Lever Sensitivity Test shows which lever to pull first, and it's rarely the one leaders reach for.

How to price professional services projects: the four-gate method

I have spent enough time in agencies to know how to price professional services projects badly. The reason most projects lose money has little to do with the pricing model on the proposal. It comes down to two things nobody systematises: what the work truly costs to deliver, and what happens to that cost after the client signs. This guide fixes both with a repeatable four-gate method.

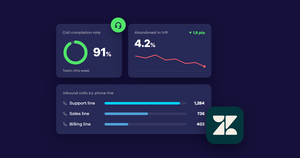
Zendesk Analytics: Five Custom Talk Metrics That Give You the Numbers You Really Need

Go beyond Zendesk Talk’s default reporting with five custom metrics (and one essential attribute) that reveal what’s really happening on your voice channel. Zendesk Voice (previously Talk) comes with a range of built-in reports, but most teams quickly find they need more flexibility as they try to drill into what’s really going on. The default metrics are often too broad to give real insight into what is happening in any meaningful way that can be actioned.