SMART ASSES - a way to set even smarter goals
If you’ve ever had to set a goal, it’s likely you’ve come across the SMART framework.* A SMART Goal is a goal that is Specific, Measurable, Assignable, Realistic, and Time-related.


If you’ve ever had to set a goal, it’s likely you’ve come across the SMART framework.* A SMART Goal is a goal that is Specific, Measurable, Assignable, Realistic, and Time-related.
From booking rep appointments to even boosting your ecommerce conversion rate, sales calls can massively impact the success of your business, which is why it’s so important to know how to measure sales productivity by the success of your calls. When the discussion of sales calls comes up, many people instantly think of cold calling (phoning prospective customers before they express any kind of interest in your product or service).
KPIs or Key Performance Indicators, are measurements that determine how well your organization is meeting its goals and objectives. KPIs are crucial to making data-driven decisions for your business. KPI dashboards provide a single screen of useful charts and graphs to easily measure your progress and performance. As such, when determining what KPI charts to use, consider your industry focus, project planning methodology, and business goals.
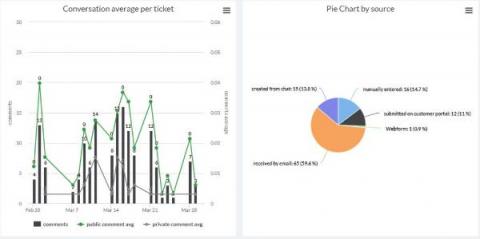
The analytics dashboard in OneDesk can be used to quickly view performance indicators and relevant charts for your organization. This dashboard can be configured to easily show the charts and date ranges which are most relevant to you and your business.
It can feel like there’s little more to say about remote working. We know about the pressures on businesses, the adjustment to makeshift bedroom offices, and the way some workers have gradually gravitated to hoping they never see a return to traditional office structures.
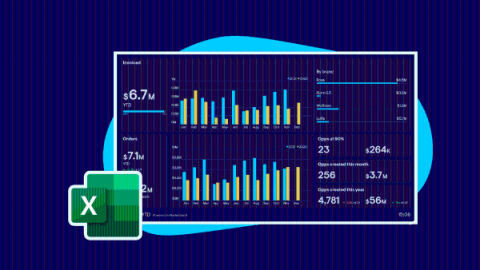
Whether it’s Microsoft Excel or Google Sheets, most businesses use spreadsheet tools. In fact, if you're a small to medium sized business (SME), it’s likely that spreadsheets are your main way of tracking sales performance. However, there is one huge downside to both Excel and Google Sheets – data visualization. When it comes to visualizing your KPIs, spreadsheets are not a great tool for helping people quickly and easily understand what’s going on.
In this article we’ll explore why many Customer Service teams are turning to IQS (Internal Quality Score) as their North Star metric to guide their customer service quality. Fantastic customer service quality occurs when customer wants are met and surpassed through support interactions. But the ‘customer wants’ box is a difficult one to tick.